
If there is one investment that has created more long-term wealth for everyday people than any other, it is the S&P 500. Over the past century, this index has delivered average annual returns of approximately 10% — turning consistent, patient investors into millionaires not through luck or speculation, but through the simple power of compounding time and money. In a world crowded with complex financial products, expensive fund managers, and endless market predictions, the humble S&P 500 index fund remains the single most powerful wealth-building tool accessible to anyone with a brokerage account.
In this comprehensive guide, you will learn exactly what the S&P 500 is, how to invest in it, which funds to choose in 2025, how to maximize tax efficiency, and the psychological strategies that separate successful long-term investors from those who leave decades of returns on the table.
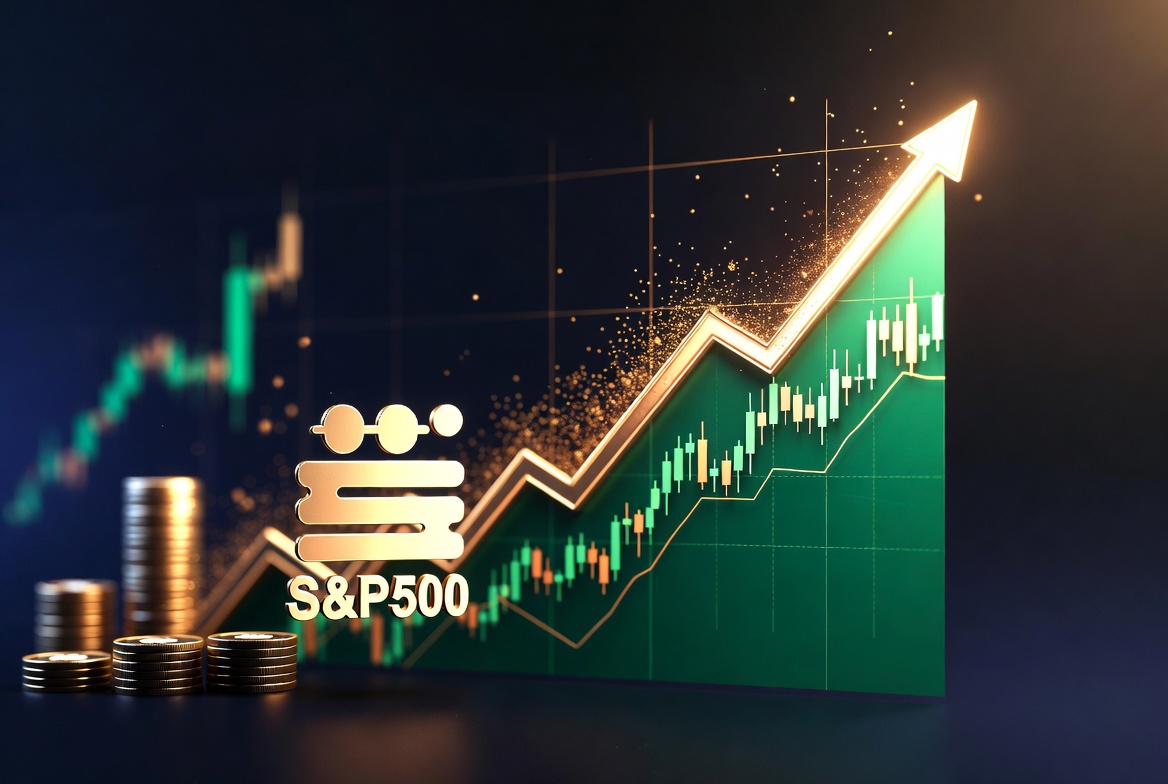
What Is the S&P 500?
The S&P 500 — formally the Standard & Poor’s 500 — is a stock market index tracking 500 of the largest publicly traded companies in the United States. Maintained by S&P Dow Jones Indices, it covers roughly 80% of the total U.S. stock market by capitalization and includes companies across every major sector: technology, healthcare, financials, consumer goods, energy, and industrials.
Names like Apple, Microsoft, Amazon, Alphabet, Nvidia, and Berkshire Hathaway sit alongside hundreds of other household brands. Because it is a market-cap-weighted index, larger companies exert more influence on its daily performance. As of 2025, the top 10 holdings account for nearly 35% of the index — a level of concentration that reflects the dominance of U.S. technology megacaps over the past decade.
The index is not static. Companies are added and removed on a quarterly basis by a committee at S&P Dow Jones Indices, based on criteria including market capitalization (minimum $18 billion), liquidity, domicile, and financial viability. This built-in quality filter means the S&P 500 automatically reflects the evolving landscape of American business — shedding struggling companies and incorporating emerging leaders over time.
The Historical Case: Why the Data Is So Compelling
Warren Buffett — arguably the greatest investor in history — has repeatedly stated that most people, including professional fund managers, would be better off simply buying and holding a low-cost S&P 500 index fund. His reasoning is backed by decades of hard data.
According to annual SPIVA reports, over any given 15-year period, more than 90% of actively managed large-cap U.S. stock funds underperform the S&P 500 after fees. Over 20-year periods, the figure rises to 95%+. The culprit is not incompetence — it is cost. Management fees, trading costs, and tax drag compound over time and quietly erode the returns that active strategies generate.
A $10,000 investment made in 1990 in an S&P 500 index fund would be worth over $230,000 today with dividends reinvested. The same amount sitting in a 2% savings account would have grown to roughly $18,000. The gap is not just large — it is life-changing, and it keeps growing with every year you stay invested.
Some additional historical context worth understanding:
- The S&P 500 has delivered positive returns in approximately 73% of all calendar years since 1926.
- The worst single-year return was approximately -38% in 2008. Every subsequent year by 2013, the index had fully recovered and reached new highs.
- The average bull market has lasted approximately 5.5 years with average gains of 180%. The average bear market has lasted approximately 9.6 months with average losses of 36%.
- An investor who missed just the 10 best trading days in the market over the past 20 years would have seen their returns cut roughly in half — a powerful argument for staying invested through downturns.
The Power of Compounding: Why Time Is Your Greatest Asset
Albert Einstein is often credited with calling compound interest the eighth wonder of the world, and when applied to S&P 500 returns, its effect is extraordinary. The key insight is that you earn returns not just on your original investment, but on every dollar of return you have ever received — a snowball effect that accelerates dramatically over time.
Consider two investors. Investor A starts at age 25 and contributes $300 per month until age 35, then stops completely. Investor B waits until age 35 and contributes $300 per month all the way until age 65. Assuming a 10% average annual return, Investor A — who contributed for only 10 years — ends up with more money at retirement than Investor B, who contributed for 30 years. The 10-year head start is worth more than 30 years of later contributions. This is the compounding advantage, and it cannot be manufactured — only earned through starting early and staying invested.
How to Invest in the S&P 500 in 2025
You cannot buy the S&P 500 directly — it is a mathematical index, not a tradeable asset. Instead, you invest through funds designed to replicate its performance. There are two main vehicles: index mutual funds and ETFs.
Best S&P 500 Index Mutual Funds
Index mutual funds pool money from thousands of investors to buy all 500 stocks in proportion to their market-cap weightings. They are priced once per day after market close and can typically be purchased directly through a fund company or brokerage.
- Fidelity 500 Index Fund (FXAIX) — Expense ratio: 0.015%. No minimum investment. One of the cheapest and most accessible options available anywhere. Ideal for investors opening their first Fidelity account.
- Vanguard 500 Index Fund Admiral Shares (VFIAX) — Expense ratio: 0.04%. Minimum: $3,000. The fund that pioneered index investing, launched by John Bogle in 1976.
- Schwab S&P 500 Index Fund (SWPPX) — Expense ratio: 0.02%. No minimum. Ideal for Schwab account holders. Often included in Schwab’s commission-free ETF program.
Best S&P 500 ETFs
S&P 500 ETFs function like mutual funds but trade on exchanges throughout the day like individual stocks. They offer more flexibility in timing purchases and are often more tax-efficient in taxable accounts due to lower capital gains distributions.
- Vanguard S&P 500 ETF (VOO) — Expense ratio: 0.03%. Warren Buffett has specifically recommended this fund for his estate’s trustees. One of the most purchased ETFs in the world, with over $500 billion in assets under management.
- iShares Core S&P 500 ETF (IVV) — Expense ratio: 0.03%. Managed by BlackRock. Excellent long-term buy-and-hold option with deep liquidity and tight bid-ask spreads.
- SPDR S&P 500 ETF Trust (SPY) — Expense ratio: 0.0945%. The oldest ETF in existence, launched in 1993. Preferred by active traders due to its superior liquidity and options market depth.
For most long-term investors, VOO or IVV are optimal due to their low cost and simplicity. SPY’s advantage is liquidity for traders, but the slightly higher expense ratio makes it marginally less attractive for buy-and-hold investors over multi-decade periods.
Understanding Dividends and Total Return
S&P 500 returns come from two sources: price appreciation (stocks going up in value) and dividends (companies distributing a portion of profits to shareholders). Historically, reinvested dividends have accounted for roughly 40% of the index’s total return — a contribution that has declined as technology companies with minimal dividends have grown to dominate the index.
The S&P 500’s current dividend yield hovers around 1.3–1.5% annually, which may seem modest, but reinvested over decades it creates a compounding engine of significant power. Always enable dividend reinvestment (DRIP) through your brokerage unless you specifically need the income, as manually reinvesting small quarterly dividend payments is administratively burdensome and easy to neglect.
The Best Accounts for Tax-Efficient S&P 500 Investing
Where you hold your investments matters nearly as much as what you invest in. Smart account placement can save tens of thousands of dollars in taxes over a lifetime of investing.
401(k) and Employer-Sponsored Plans
If your employer offers a 401(k) match, capturing that match is the single highest-return financial move available to you — it is an immediate 50–100% return on your contribution. The 2025 employee contribution limit is $23,500 ($31,000 if you are 50 or older with catch-up contributions). Always look for an S&P 500 index fund option within your plan. If your plan’s index fund has an expense ratio above 0.20%, it is still almost certainly your best option within the plan — the tax advantages far outweigh modestly higher fees compared to external options.
Roth IRA: The Most Powerful Wealth-Building Account
The Roth IRA is arguably the single best investment account available to individual investors. You contribute after-tax dollars, and all future growth and qualified withdrawals are completely tax-free — forever. The 2025 contribution limit is $7,000 per year ($8,000 if you are 50 or older). For a 25-year-old who maximizes Roth IRA contributions annually for 40 years, assuming 10% average annual returns, the account could grow to over $3 million — all of it tax-free at withdrawal.
Income limits apply: single filers with modified adjusted gross income (MAGI) above $146,000 face reduced contribution limits, phasing out entirely above $161,000 (2025 figures). High earners above these limits can use the “backdoor Roth IRA” strategy — contributing to a Traditional IRA and converting to Roth — to access this account type regardless of income.
Traditional IRA
Contributions may be tax-deductible (subject to income and workplace plan coverage rules), and growth is tax-deferred until withdrawal. Required minimum distributions (RMDs) begin at age 73 under current law. Useful for high earners who exceed Roth IRA income limits and choose not to use the backdoor strategy, or for investors who expect to be in a lower tax bracket in retirement.
Taxable Brokerage Account
Once tax-advantaged accounts are maxed out, a standard taxable brokerage account is the next step. No contribution limits, no restrictions on withdrawals, no required minimum distributions. Long-term capital gains rates (0%, 15%, or 20% depending on income) apply to positions held over one year — significantly lower than ordinary income rates for most investors. S&P 500 index funds are particularly tax-efficient in taxable accounts due to their low portfolio turnover and the resulting minimal capital gains distributions.
Dollar-Cost Averaging: The Strategy That Eliminates the Market Timing Problem
The single most common and costly mistake new investors make is waiting for the “right moment” to invest. Decades of research confirm that attempting to time the market consistently fails — even for professionals with access to sophisticated analytical tools. Studies show that investors who attempt market timing underperform simple buy-and-hold strategies by an average of 1.5–2% per year, primarily due to being out of the market during its best days.
The solution is dollar-cost averaging (DCA): investing a fixed amount at regular intervals (weekly, monthly, or quarterly) regardless of what the market is doing. When markets drop, your fixed contribution buys more shares. When they rise, it buys fewer. Over time, this naturally lowers your average cost per share and removes the emotional stress of trying to time entries.
Setting up automatic monthly contributions to your S&P 500 fund through your brokerage is one of the highest-impact, lowest-effort financial habits you can build. Most major brokerages — Fidelity, Vanguard, Schwab, and others — allow you to automate recurring purchases with zero friction. Learn more about this approach in our guide on Dollar-Cost Averaging for Volatile Markets.
S&P 500 Sector Breakdown: What You Actually Own
Understanding the composition of the S&P 500 helps investors appreciate both its strengths and its concentration risks. As of 2025, the approximate sector weightings are:
- Information Technology: ~29% — The dominant sector, including Apple, Microsoft, Nvidia, and the semiconductor ecosystem.
- Financials: ~13% — Major banks, insurance companies, asset managers, and payment networks.
- Healthcare: ~12% — Pharmaceutical companies, medical device manufacturers, managed care organizations.
- Consumer Discretionary: ~10% — Amazon, Tesla, luxury goods, and retail companies.
- Communication Services: ~9% — Alphabet (Google), Meta, Netflix, and telecom providers.
- Industrials: ~8% — Aerospace, defense, logistics, and manufacturing conglomerates.
- Consumer Staples: ~6% — Procter & Gamble, Coca-Cola, Walmart, and other essential goods companies.
- Energy, Materials, Real Estate, Utilities: ~13% combined — Natural resources, commodities, REITs, and regulated utilities.
The technology-heavy weighting has been both a feature and a risk over the past decade. Tech’s outperformance drove exceptional S&P 500 returns, but also means the index is more exposed to technology sector downturns than historically diversified portfolios. Investors concerned about this concentration can complement their S&P 500 holdings with an equal-weight S&P 500 fund (such as RSP) or international equity funds to reduce tech sector dependency.
Tax-Loss Harvesting with S&P 500 Funds
One of the most valuable tax optimization strategies available to S&P 500 investors in taxable accounts is tax-loss harvesting: intentionally selling a position at a loss during market downturns to realize a tax deduction, then immediately reinvesting in a similar (but not identical) fund to maintain market exposure.
For example, if you hold IVV and the market drops 15%, you could sell IVV and immediately buy VOO or SPY — both track the S&P 500 but are considered distinct securities for IRS wash sale purposes. You bank the tax loss while remaining fully invested. These harvested losses can offset realized capital gains elsewhere in your portfolio or provide up to $3,000 per year in deductions against ordinary income, with unlimited carryforward to future years. For a full deep-dive into this strategy, see our guide on Tax-Loss Harvesting 2025.
Comparing S&P 500 to Other Major Asset Classes
The S&P 500 does not exist in a vacuum. Understanding how it compares to other investment options helps clarify when and why it may or may not be the right choice for specific portions of a portfolio.
Compared to individual stocks, the S&P 500 offers dramatically lower risk through diversification, but also caps your upside — you will never experience a 10x return in a single year from an index fund. Research consistently shows that the majority of individual stocks underperform their benchmark index over time; the index’s exceptional returns are driven by a relatively small number of extraordinary performers that are difficult to identify in advance.
Compared to international stocks, the S&P 500 has significantly outperformed over the past 15 years, though history suggests this is likely to mean-revert at some point. Many financial planners recommend holding 20–30% of an equity portfolio in international funds to reduce dependence on U.S. market performance.
Compared to real estate, the S&P 500 is more liquid, requires less capital, and has historically delivered comparable total returns when accounting for maintenance costs, property taxes, and vacancy rates. For a detailed comparison, see our article on Real Estate vs. Stock Market 2025.
Compared to cryptocurrency, the S&P 500 offers dramatically lower volatility, regulatory clarity, and a multi-century track record. Most financial advisors who are open to crypto suggest capping the allocation at 5–10% of a portfolio maximum, using the S&P 500 as the stable core.
Common Mistakes S&P 500 Investors Make
- Selling during market crashes: Every bear market in S&P 500 history has been followed by full recovery and new all-time highs. Selling during a downturn locks in losses and guarantees you miss the rebound. The investors who built the most wealth did so by staying invested through every crisis.
- Not reinvesting dividends: Dividend reinvestment dramatically accelerates long-term compounding. Historical data shows that reinvested dividends account for roughly 40% of total S&P 500 returns over long periods. Treating dividends as income to spend rather than capital to reinvest leaves enormous returns unrealized.
- Paying high expense ratios: A 1% difference in annual fees can cost over $100,000 on a $200,000 portfolio over 30 years. The math is unambiguous — every dollar paid in fees is a dollar that cannot compound for decades. Compare fees before choosing any fund.
- Stopping contributions during volatility: Market downturns are effectively a sale on stocks. Stopping contributions when prices fall is the opposite of rational investing behavior — it means buying fewer shares when they are cheapest and more shares when they are expensive.
- Panic-checking the portfolio daily: Research shows that investors who monitor their portfolios more frequently make more emotional decisions and achieve worse outcomes. Checking monthly or quarterly is sufficient for a long-term S&P 500 investor.
- Holding too much cash waiting for a crash: Research by J.P. Morgan consistently shows that investors who hold cash waiting for the “perfect” buying opportunity underperform those who invest immediately, because the market spends far more time rising than falling.
Building a Complete Portfolio Around the S&P 500
While the S&P 500 is an excellent core holding, truly diversified long-term portfolios typically include complementary assets that reduce correlation and improve risk-adjusted returns:
- International developed market funds (e.g., VEA) for exposure to Europe, Japan, Australia, and other major economies at lower valuations than the U.S. market.
- Emerging market funds (e.g., VWO) for exposure to high-growth economies in India, Brazil, and Southeast Asia, accepting higher volatility in exchange for long-term growth potential.
- U.S. bond funds (e.g., BND) as a portfolio stabilizer during equity drawdowns, with allocation typically increasing as retirement approaches.
- Small-cap value funds for exposure to the historically documented small-cap value premium, which has outperformed large-cap growth over very long time horizons despite underperforming during the recent tech bull market.
- A modest crypto allocation (5% or less) for investors comfortable with volatility and long time horizons. See our analysis on Cryptocurrency vs. Traditional Investment.
Frequently Asked Questions
Is it too late to invest in the S&P 500?
This question has been asked at every market high in history. The answer is consistently no. If you have a 10+ year horizon, the best time to invest is as soon as possible, regardless of current price levels. Research shows that even investing at market highs (the worst possible timing) produces better long-term results than staying in cash and waiting for a better entry point that may never come.
How much money do I need to start?
With fractional shares now available at most major brokerages, you can start with as little as $1. Fidelity’s FXAIX has no minimum investment requirement. Practically, starting with $100–500 and setting up automatic monthly contributions of whatever you can afford is a realistic and proven approach for most people beginning their investing journey.
What is the average annual return of the S&P 500?
Approximately 10% per year before inflation, or roughly 7% after inflation, over the past century. Individual years vary enormously — from gains exceeding 30% to losses exceeding 35% — but the long-term trend has been remarkably consistent. The longer your holding period, the more your actual return converges toward this historical average.
VOO vs. IVV vs. SPY — which should I choose?
All three track the same index and will deliver nearly identical long-term performance. For buy-and-hold investors, VOO and IVV are marginally superior due to lower expense ratios (0.03% vs. 0.0945% for SPY). SPY’s edge is its unmatched liquidity and deep options market, which benefits traders but adds no value for long-term investors. Choose any of the three and stop second-guessing — the difference over 30 years is minimal compared to the difference between investing and not investing.
Should I invest a lump sum all at once or spread it out over time?
Research by Vanguard found that lump-sum investing outperforms dollar-cost averaging approximately two-thirds of the time because markets tend to rise over time — the sooner your money is invested, the longer it benefits from that upward trajectory. However, DCA is psychologically easier for most people and reduces the risk of investing your entire sum at a temporary market peak. For large windfalls, a hybrid approach — investing 50–60% immediately and spreading the rest over 6–12 months — balances mathematical optimality with emotional manageability.
What happens to my S&P 500 investment if the U.S. economy enters a recession?
Recessions typically cause S&P 500 declines of 20–40%. However, markets often begin recovering before the recession officially ends — by the time economic data confirms a recovery, stock prices have frequently already rebounded significantly. Attempting to sell before a recession and buy back at the bottom is virtually impossible to execute correctly in practice. Staying invested through recessions has historically produced far better outcomes than attempting to time them.
Conclusion
The S&P 500 is not an exciting investment — and that is exactly the point. It will not make you wealthy overnight, and it will not give you thrilling stories to tell at parties. What it will do — if you stay invested through market cycles, reinvest dividends, keep costs low, and contribute consistently over decades — is compound your wealth steadily and reliably in a way that the vast majority of active investment strategies fail to match.
In an investing world full of noise, complexity, and products designed to generate fees rather than returns, the S&P 500 index fund stands out as a rare exception: simple, cheap, transparent, and historically proven. Start today, automate your contributions, and let time do the heavy lifting. For more on building long-term wealth, explore our guides on Building Wealth in Your 20s, Dividend Investing 2025, and Index Funds vs. Active Funds.